
What is a Synoptic Weather Chart?
- LearnToFlySmart

- Jun 7, 2025
- 3 min read
Updated: 2d
As pilots, we frequently use weather forecasts or reports such as TAF (Terminal Aerodrome Forecast), METAR (Meteorological Aerodrome Report), and GAF (Graphical Area Forecast) to find specific data we need, like wind speed, wind direction, and cloud base altitude. These are all very useful for our daily operational requirements.
However, these reports don't explain the reasons behind these occurrences. To understand more about for example: why wind direction changes at certain times, gusts increase, and the sky remains clear all week, you need to look at a broader perspective. A synoptic chart is very helpful for this!
What are the main features?
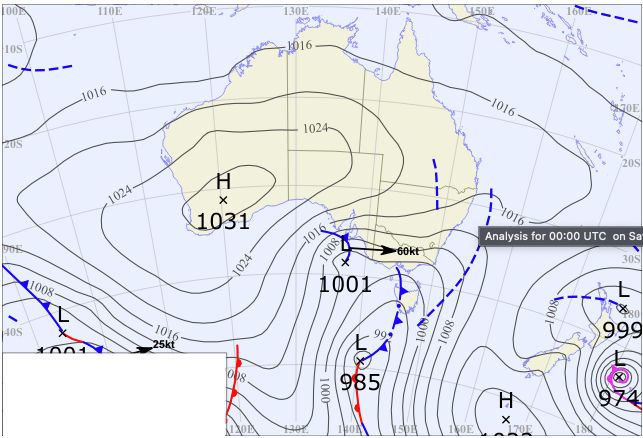
Isobars
Isobars are the plain lines that curve across the map, connecting points with the same mean sea level air pressure. Some isobars are labeled with numbers indicating this pressure in hectopascals (hPa).
Isobars show the flow of air around weather systems, allowing for a general interpretation of wind strength and direction. Typically, winds are strongest where isobars are closest together, often near cold fronts, low pressure systems, tropical cyclones, and in westerly airstreams south of Australia. Winds tend to be lighter near high pressure systems where isobars are spaced widely.
High and low pressure systems
High and low pressure systems are marked by numbers indicating the central mean sea level pressure. Standard sea level pressure is 1013 hPa, but high and low pressures are relative to the surrounding environment. A typical high is around 1020 hPa or more, while a shallow low is above 1000 hPa, a moderate low ranges from 980–1000 hPa, and a deep or intense low is below 980 hPa. An intense cyclone might have a central low pressure of around 960 hPa or lower.
High pressure systems
A high pressure system is an area of higher pressure relative to its surroundings, marked by an 'H' and a number indicating the pressure on the chart.
In the southern hemisphere, wind flows anticlockwise around and away from a high pressure system. Air sinks and warms as it descends, leading to stable conditions, dry weather, and light winds.
Learn about 'blocking' high pressure systems that disrupt low pressure systems across southern Australia, and the sub-tropical ridge, a belt of high pressure systems south of Australia in summer and over central Australia in winter.
Low pressure systems
Conversely, a low pressure system is an area of lower pressure relative to its surroundings, marked by an 'L' and a number showing the central mean sea level pressure. In the southern hemisphere, wind flows clockwise around a low pressure system. As air descends from a high pressure system, it moves towards a low pressure center, rises, cools, and forms clouds, leading to instability and further rising.
Lows typically bring cold, wet, and windy weather, with closely spaced isobars indicating stronger winds.
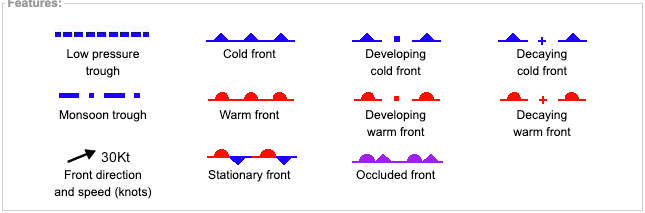
Fronts
Cold front
A cold front marks the boundary between warm and cooler air. It is shown as a blue line with small blue triangles on a weather map. As cold air moves in, it forces warm air to rise, cool, and condense into clouds, often leading to rain.
Cold fronts are linked to wind direction changes and temperature drops. In summer, they can increase fire danger due to hot, dry conditions and gusty winds. In winter, they can bring strong winds, heavy rain, and cold air, sometimes causing snow at low levels.
Warm front
Warm fronts appear as a red line with semi-circles, representing the gradual replacement of cool air with warmer air. The temperature change is less abrupt than with cold fronts.
Warm fronts are less common over Australia and can bring steady rain, grey skies, and humidity. When a cold front overtakes a warm front, they form an 'occluded front,' usually bringing rainfall.
An occluded front is shown as a purple line with triangles and semi-circles on one side.
Stationary front
A stationary front, shown with alternating blue and red colors, has triangles on one side and semi-circles on the other. It signifies a boundary with little movement, often resulting in prolonged rainfall for those underneath.
Troughs
A trough is represented by a dashed blue line on the map. It is an elongated area of low atmospheric pressure, separating different air masses, typically moist and dry air.
As a trough moves, it lifts moist air, forming clouds or showers and thunderstorms. If it moves in the opposite direction, it drags the moist air along.
Monitor the monsoon trough, which annually shifts over northern Australia, drawing moist air from oceans and bringing cloudy conditions, heavy rain, thunderstorms, and squalls.
Comments